Run Lighthouse on your published site, then record your results so you can track progress.
A Lighthouse audit gives you a performance score and a prioritized list of what to fix. Record those results before you change anything, and you'll have proof of what improved and a clear place to start.
Before you get started
Publish your site first. Always audit the live site on your real domain, not the Designer or a preview link, so the results reflect what visitors get.
Run an audit in PageSpeed Insights
PageSpeed Insights needs no setup and works on any device. It also shows real-visitor data alongside your Lighthouse results.
To run an audit in PageSpeed Insights:
- Go to pagespeed.web.dev
- Type in the URL of your published page
- Click Analyze
- Choose the Mobile or Desktop tab to switch between results
Run an audit in Chrome DevTools
Chrome DevTools gives you more control and detail, right in your browser. Test mobile first. It's the hardest case, it's Google's default view, and it's how many visitors experience your site.
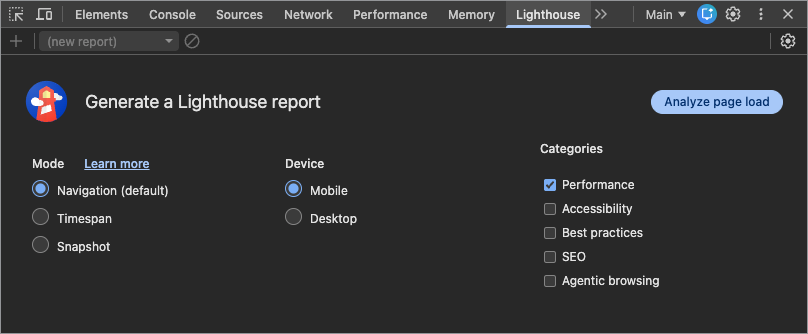
To run an audit in Chrome DevTools:
- Open your published site in a Chrome incognito window, since extensions can distort results
- Open DevTools — press F12, or press Cmd + Option + I on a Mac
- Go to the Lighthouse tab
- Choose Mobile as the device
- Choose the Performance category
- Click Analyze page load
Read your results
When the report opens, you'll see a performance score from 0 to 100 and the individual metrics below it. Scores fall into three ranges:
-
90–100 — good
-
50–89 — needs improvement
-
0–49 — poor
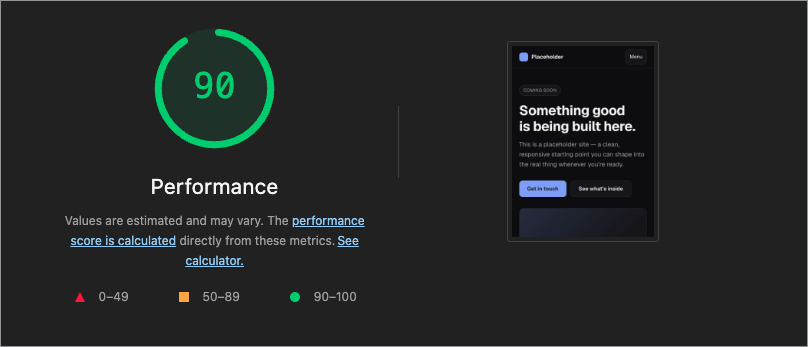
The score is a summary, but the metrics tell the story. A green score with a slow Largest Contentful Paint (LCP) still means visitors wait too long to see your main content. Look at the recommendations section of the report to see what Lighthouse suggests fixing and how much time each change could save.
Lighthouse throttles the page to simulate a mid-tier device on a slow connection, so results often look slower than your laptop feels. That's intentional. It shows you the experience of a visitor with less ideal conditions.
Set your baseline
Before you fix anything, write down where you are. A baseline turns "the site feels faster" into numbers you can compare, share with a client, and use to decide what to tackle first.
To set a baseline for your site:
- Pick the pages that matter most — your homepage plus three to five of your highest-traffic pages
- Run Lighthouse on each page, once for mobile and once for desktop, in an incognito window
- Repeat each audit two to three times and note the median result
- Record the date, URL, device, performance score, and LCP, INP, and CLS values in a spreadsheet
- Review the recommendations in each report and sort them by estimated time savings
Lighthouse results vary a few points from run to run because of network conditions, caching, and simulation noise. Taking the median of two to three runs smooths that out.
Pro tip
Run the Webflow health scan too. It gives you a site-level snapshot of hosting, style, and font checks you can compare against later. Learn how to run a health scan.
Pick your battles
You don't need a perfect 100. You need healthy metrics on the pages that matter most. Work through your results in this order:
-
Start with the biggest wins — fix the items with the largest estimated savings first
-
Move red to yellow, then yellow to green — focus on the worst metrics before polishing the ones that already pass
-
Change one thing at a time — publish, then re-test under the same conditions so you know which change helped
The rest of this category walks you through the most common fixes for images, fonts, video, styles, and scripts.
Start fixing what you found